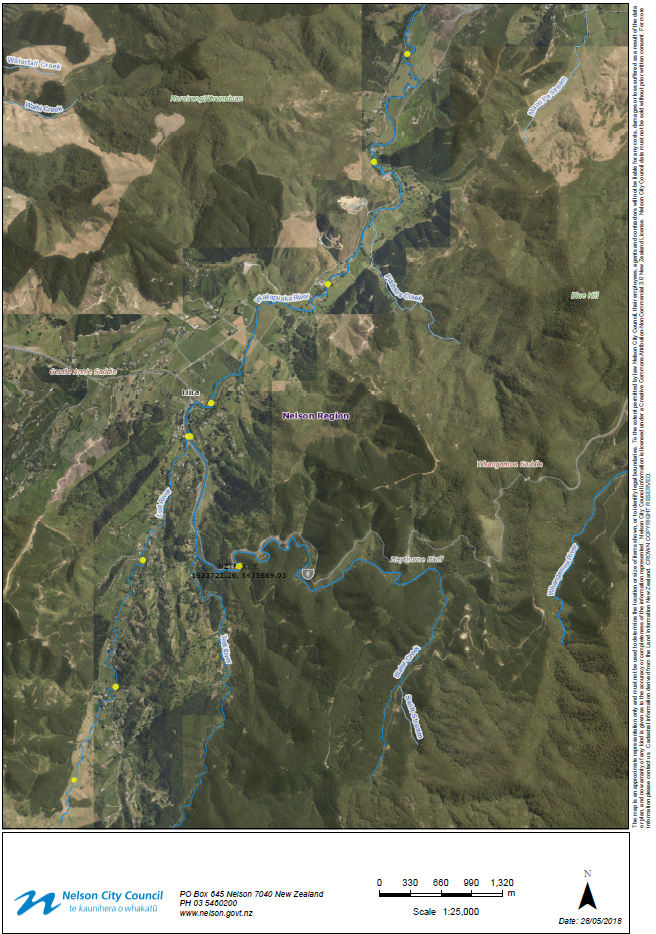
E.Coli Monitoring in the Wakapuaka Catchment
Monitoring water quality over the last ten years at Hira and Paremata Reserve swimming holes and throughout the Wakapuaka catchment shows that E. coli bacteria levels can regularly occur at high levels deemed unsafe for contact recreation and stock drinking water.
The elevated bacteria levels at the swimming holes have also resulted in more frequent Public Health Warnings over the summer months.
In 2018 Council undertook a bacteria source tracking study in the Wakapuaka catchment to identify the animal sources that are contributing to the high levels of E. coli bacteria recorded in the river.
Water samples were collected at ten sites in May 2018 during a dry spell of weather to avoid the influence of stormwater runoff from land contaminating water quality. Follow up samples were collected at the same sites, and five additional sites on tributaries, in August and October during rain events to include stormwater contaminated with E. coli.
The August rain event totalled 6mm over the day, with the peak flow of 1,200 litres/second at Hira, coinciding with the E. coli sample taken. The October rain event totalled 67mm over the day, with the peak flow of 15,000 litres/second at midnight prior to sampling.
E.coli results
During dry weather the E. coli concentrations ranged between 29 to 263 cfu/100ml which increased to between 180 to >10,000 cfu/100ml E. coli in samples taken during periods of heavy rain and significant runoff over land.
The lower results (i.e. less than 30 cfu/100ml E. coli) were collected at the head of the Wakapuaka and Lud sub-catchment, above the influence from domesticated stock, so represent a background level. Overall the E. coli concentrations generally increased heading down the catchment into areas of more intensive landuse.
The smaller tributaries of the Lud and Wakapuaka had the highest E. coli concentrations recorded during wet weather sampling, partly through dilution of E. coli at other sites in the main stem of the river reaches.
However, for the August sample the Lud only contributed approximately 25% of the 3x10⁶ E. coli load recorded at Hira around the peak flow.
The October Hira flow was 7,500 litres at the time of sampling, equating to an E. coli load of 75x106 bacteria. The corresponding Lud high flows cannot be estimated readily with existing hydrology data.
E.coli source tracking
The lab analysis of E. coli markers was only undertaken on the samples with elevated E. coli recorded in August and October. In August, the majority of sites on the Wakapuaka and Lud had high consistent matches with sheep, cow and avian as dominant bacteria sources.
Aged faeces from sheep and birds were detected in the lower Wakapuaka catchment. In October, the contribution of E. coli from sheep, cow and avian was present at all sites, with greater influence from stormwater runoff. Possible human faecal sources were detected in the mid and lower Wakapuaka catchment, though at the lowest detection level.
Conclusions
During dry weather, E. coli levels in the Wakapuaka catchment can occur at levels that trigger Public Health Warnings at swimming holes due to E. coli from sheep, cows, birds and bacteria resident in soil and river sediment. E. coli levels increase markedly with rain events, through contaminated stormwater.
The August sampling of E. coli coincided with the peak flow and whilst relatively low rainfall and runoff is likely to reflect E. coli runoff from local to the sample point.
The October rain event was sampled at least 6 hours after the peak flow and with more persistent rainfall is likely to reflect E. coli runoff discharged from the wider catchment, and potentially missed the ‘first flush’ peak E. coli load.
The E. coli source tracking showed that a range of animals contribute to the high E. coli levels observed, including faeces from sheep, cows and birds (ducks, gulls and geese).
Possible human faecal sources were detected at low levels in the mid-Wakapuaka catchment, which could be from inundated septic tanks during heavy rainfall.
|
Site |
22/05/2018 Average E. coli (cfu/100ml) |
29/08/2018 Average E. coli (cfu/100ml) |
12/10/2018 Average E. coli (cfu/100ml) |
|
Rainfall and resulting runoff from land |
Dry with no runoff |
Light rain and slight runoff |
Heavy rain and significant runoff |
|
Wakapuaka at Duckpond Rd |
33 |
12 |
180 |
|
Wakapuaka u/s Lud conf. |
70 |
97 |
ns |
|
Teal |
ns |
ns |
286 |
|
Lud @4.7km |
29 |
14 |
420 |
|
Macs Rd tributary |
ns |
2,150 |
1,850 |
|
Lud d/s Macs Rd |
116 |
1,050 |
990 |
|
Lud u/s Frost Rd |
216 |
1,350 |
2,650 |
|
Lud d/s Frost Rd |
ns |
913 |
(610) |
|
Lud @SH6 |
217 |
670 |
3,400 |
|
Wakapuaka at Hira Reserve |
93 |
253 |
1,050 |
|
Wakapuaka at 90 Cable Bay Rd |
ns |
161 |
908 |
|
Rayners tributary at conf. with Wakapuaka |
ns |
2,200 |
>10,000 |
|
Wakapuaka at Adventure Park |
263 |
523 |
6,300 |
|
Wakapuaka d/s Pitchers Creek |
ns |
386 |
4,100 |
|
Wakapuaka at Maori Pa bridge |
177 |
108 |
4,850 |
|
Wakapuaka at Paremata flats |
163 |
125 |
2,150 |
E.Coli monitoring locations

